Findings · Student survey
Nobody taught us this.
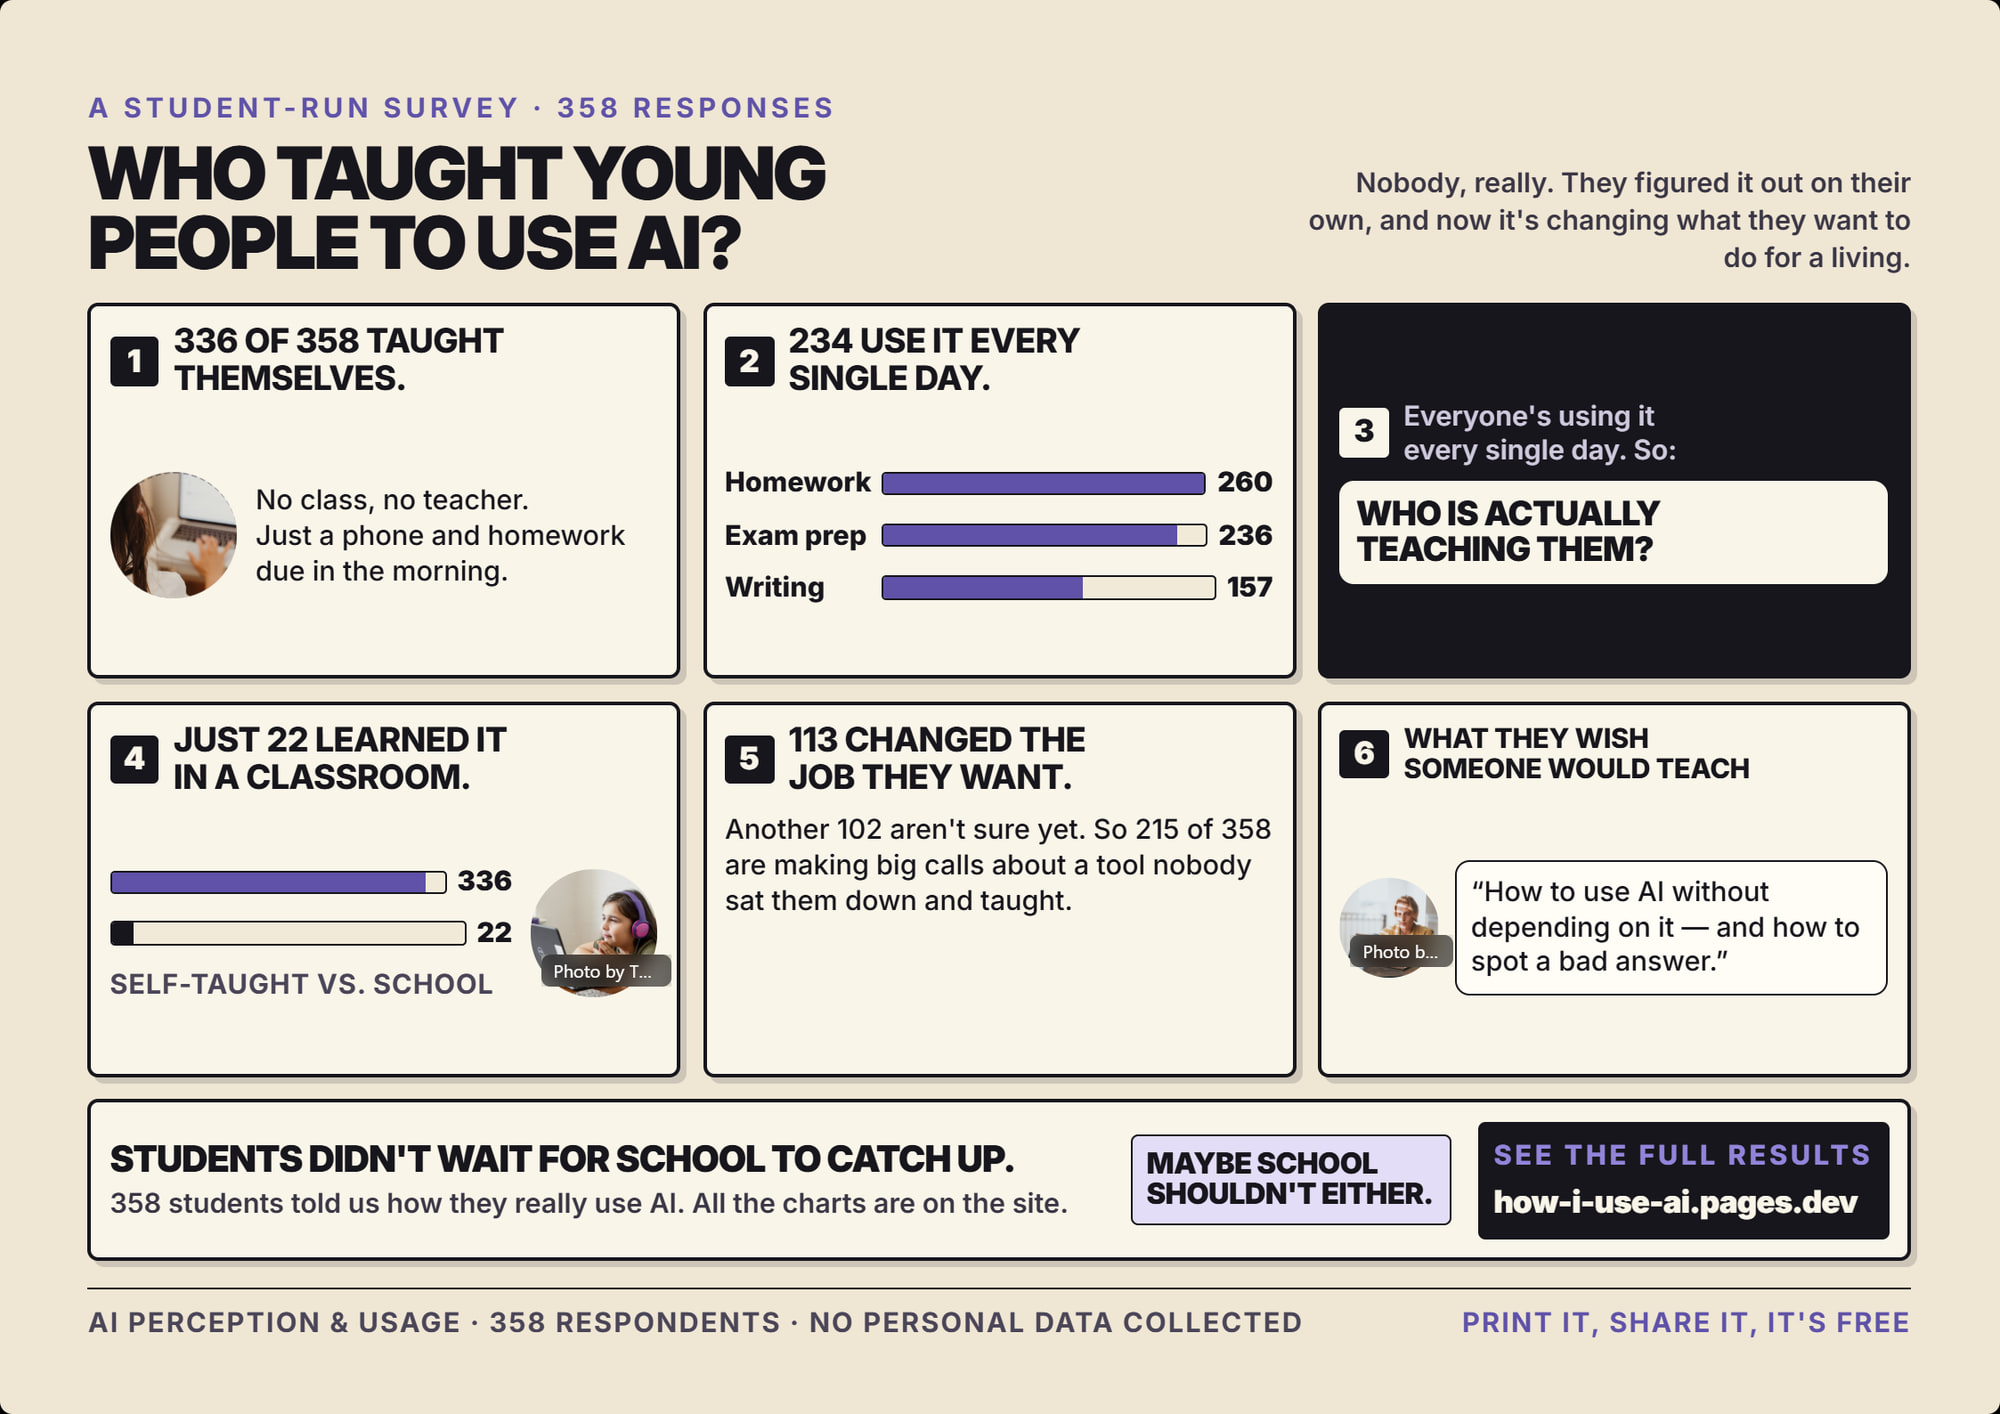
358 students told us how they use AI. Only 6% were taught it at school. They score it 6.5 out of 10 for reliability anyway.
358 responses · updated 22 Aug 2026 · collection still open
School taught almost nobody.
We asked where students learned to use AI. 94% taught themselves. 10% learned from YouTube. School? 6%.
“Almost everyone worked it out on their own.”
How have you learned to use AI?
n = 358Multiple answers allowed, so shares do not sum to 100%.
They use it constantly. They still call it a 5.
49% of students open AI several times a day. Only 5% never touch it. But asked how much they actually depend on it for school work, the most common answer and the middle answer were both 5 out of 10.
“Reaching for it every day is not the same as leaning on it.”
Dependence on AI for school and exam prep
n = 3580–10 scale. Mean 5, median 5.
They trust it more than anyone taught them to.
Students score AI 6.5 out of 10 for reliability. That is a lot of trust for a skill almost nobody was taught. 69% have never paid for a tool, and 21% say they don't even know where to start getting better.
“Plenty of trust. Almost no training. Nobody checking.”
What stops you from getting better at AI?
n = 358Single answer per respondent.
Method
the honest small print
The whole story, on one page
free to print and share
- 01The questions
- 02Your results
- 03What we found
- 04The report
- 05Your card
Next
The report
The whole survey written up, as a PDF you can cite.